The $55M i3 trial of “Reading Recovery”
Results were biased by measuring outcomes when the intervention group hit their success target.
Reading Recovery (RR), a method for helping poor readers, designed on the basis of research in the 1970s by New Zealand psychologist Marie Clay, is a worldwide movement. It is controversial, partly because it is a semi-secret commercial programme for which schools or parents have to pay, and partly because it emphasises “whole language” rather than phonics based methods.
In 2015 RR was evaluated in a large and expensive ($55M) randomised controlled trial in the United States. The report of the first year of the randomised element (click here ) is behind a paywall, but a copy is available here i3 reading recovery trial. The full report of all four randomisation years, as well as the non-randomised scale-up phase is free (click here) or reading_recovery_final_report.
The trial has been criticised by some educationalists (click here) who appear to be more politically opposed to RR, than to have identified genuine flaws in the trial’s methods. They cite four “problems”. 1. Many low achievers were excluded. Answer: They were excluded from intervention and control groups equally, so did not bias the results. 2. The control group received a range of different experiences. Answer: Yes. They got “usual care”, common practice in a pragmatic trial. 3. The successful completion rate of students in the program was modest. Answer: Yes, but it still appeared to work. 4. No data supported the claim that Reading Recovery leads to sustained literacy learning gains. Answer: A valid criticism. Long term effects could not be measured in the randomised groups, because controls got RR at the end of the intervention period anyway. Other critics have repeated the claims that the effect of RR was small but not sustained (click here) or focused on lack of definition of what the control group got (click here).
The trial also has defenders (e.g. click here). The What Works Clearing House, an independent outfit evaluating evidence-based educational interventions not only issued a special evaluation (click here) or wwc_may_102814, but gave the trial its strongest possible endorsement; “The research described in this report meets WWC group design standards without reservations.”
I’m a medical doctor with no vested interest – I only learned of the existence of RR a few weeks ago – but I do know a bit about randomised trials. So far as I’m aware, the more fundamental flaws identified in the rest of this post, have not previously been described.
Surprisingly for such a large trial, it was unregistered (the word registration or registry does not appear in the report), nor did it have a published protocol (the word protocol appears five times but never as part of “trial protocol”), so readers have to take on trust the statement that the primary and secondary outcomes, and sample size had been pre-specified.
It was conducted “from the 2011-2012 school year through 2014-2015”. 1,254 schools participated. The research objective was “What is the immediate impact of Reading Recovery on the reading achievement of struggling 1st-grade readers, as compared with business-as-usual literacy instruction?”.
Population – “Struggling 1st-grade readers”. Staff in each school identified the eight pupils with the lowest Observation Survey of Early Literacy Achievement (OS) score.
Intervention – 30 minutes one to one Reading Recovery lessons per day for 12-20 weeks, as a supplement to regular classroom literacy instruction. These are described as “[…] individualized, short-term, highly responsive instruction […] Lessons attend to phonemic awareness, phonics, vocabulary, fluency, and comprehension [… are] intended to help students develop a set of self-regulated strategies for problem-solving words, self-monitoring, and self-correcting that they can apply to the interpretation of text [and] enabling students to use meaning, structure, letter-sound relationships, and visual cues in their reading and writing.”
The RR lessons went on for at least 12 weeks, following which they stopped when the pupil reached the target OS achievement score of 16, or at 20 weeks, whichever came first. We will return to this point.
Control – regular classroom literacy instruction and access to any literacy supports that were normally provided to low achieving 1st-grade readers by their schools, other than Reading Recovery. The researchers describe these in detail.
“We obtained information on 1,245 (57 percent) of all students assigned to the control group […]. 39 percent received no supplemental instructional supports; 37 percent participated in some individual or small-group intervention (other than Reading Recovery) provided by a Reading Recovery-trained teacher; 23 percent participated in a literacy intervention that was not delivered by a Reading Recovery teacher; and 8 percent received ELL or special education supports. Seven percent a combination of the services listed above. A majority of control group students (61 percent) did experience some form of supplemental literacy support in addition to regular classroom instruction. Therefore, in this study, we are comparing the effectiveness of Reading Recovery to that of classroom instruction plus a range of other support services that schools provide to struggling readers.”
This is clear. The trial is not, as some had alleged (click here), one of “”RR v nothing”, but of “RR v usual care”. However, the fact that the phonics/whole language components of usual care was not defined, mean the trial was never likely to contribute much to the phonics v whole language debate.
Outcome – The primary outcome was the Iowa Tests of Basic Skills (ITBS) at the end of the 12 -20 week intervention. Secondary outcomes were the Reading Comprehension and Reading Words subscales of the ITBS, and the Observation Survey described above, which had been used to define the trial entry groups and to judge the length of the programme.
Randomisation – A total of 9,784 students were identified by picking the eight children with the lowest OS score per school. 1,254 times 8 = 10,032 but the missing pupils won’t bias the result because they were lost pre-randomisation.
“[…] teachers entered the names of the selected students into an online random assignment tool, noting their English language learner (ELL) status and their baseline OS Text Reading Level (TRL) subtest scores […]. The tool then matched them into pairs by first matching any students with ELL designations, then matching the student with the lowest TRL subtest score with the next-lowest student, and so on. Once the students were matched, a randomizing algorithm then randomly assigned one student in each pair to the treatment group and the other to the control group. The result was recorded in IDEC, and the tool was locked so that randomization in that school could not be redone.”
This is good. But then:
“4,892 students were randomized to treatment, and 4,892 to control. Both pretest and posttest data were available for 7,855 of these students (4,136 treatment; 3,719 control).”
This differential drop out (more drop outs among controls) would normally be a worry because drop outs might be poorly supported students. If you remove more poorly supported students from the control group than the intervention one, the control group would end up with higher scores, even if the intervention had no effect. Fortunately the researchers were aware of the problem and took steps to avoid it.
“Pairs in which either student was missing assessment data were dropped from the RCT, leaving a total of 6,888 students who were able to be matched into pairs with complete data (3,444 matched pairs in 1,122 schools).”
Excellent. They did the right thing. If either member of a pair failed to complete the outcome measure they dropped both from analysis. As the authors put it, “Because the entire pair was dropped in the event that one student in a pair was missing outcome data, there is no differential attrition overall.” Here is the Consort flow diagram.
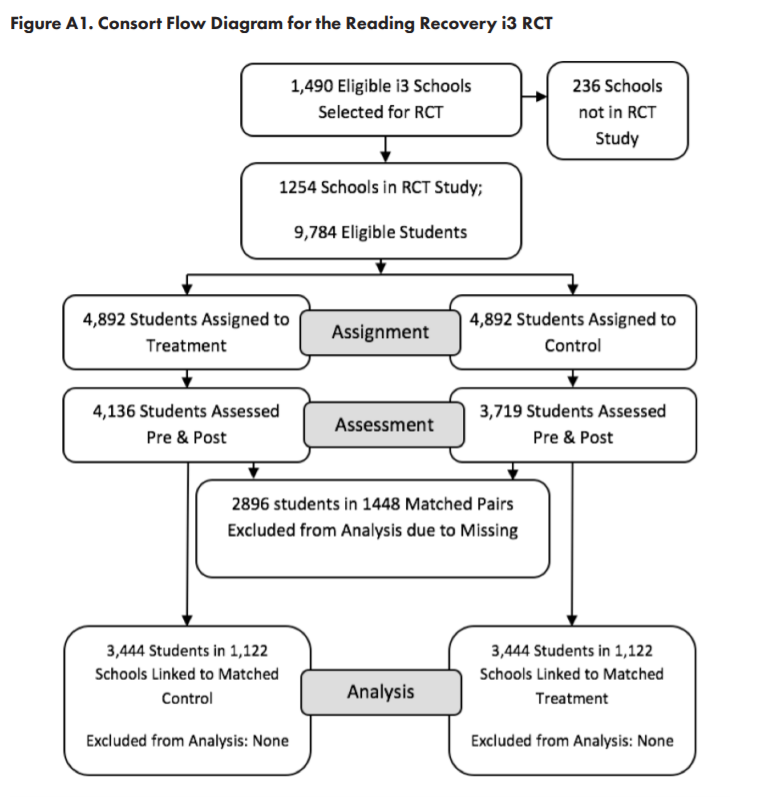
Table 2.3 (not shown here) shows the sex, race and baseline reading level of each group were, as would be expected, well balanced.
Now to the fundamental flaw; the timing of the outcome test.
“The precise timing of posttest [the short term outcomes] administration varied, as posttests were administered to both the treatment and the control student in a given matched pair immediately after the treatment student completed his or her 12- to 20-weeks of Reading Recovery lessons. This ensured that the two students experienced their assigned conditions for an identical time period. Typically, posttests were administered roughly halfway through the school year. As the study was designed as a delayed-treatment RCT, control students began receiving their Reading Recovery lessons after the posttests were administered to both treatment and control students in each matched pair.”
This sounds reasonable, but it biases results in favour of RR. Remember RR stopped when the pupil reached a score of 16 on the OS assessment, i.e at the point when the RR programme was judged to have succeeded, and the pupil could be returned to the normal classroom. Since there will surely be some day to day variation in scores due to extraneous factors, the RR group are systematically being scored on, or near to, a good day. Their control partner is measured on the same calendar day, which may or may not be a randomly good day for them*.
And here are the results. Table 2.3 and 2.4 are taken from the full (four year) trial report. For some reason tests of statistical significance were omitted from there – we’ve noticed before (click here) that some educationalists object to them – so on the right is table 2 of the first randomised year only trial report with its P values.
The top row (tables 2.3 and 2.4) shows the mean ITBS score at the end of the RR or control period. i.e. up to the point at which RR succeeded, or 20 weeks, whichever was sooner. The percentile ranks show where that score would lie on typical Grade 1 mid year scores. Rank 1 the worst reading centile, and 100 the best reading. In table 2 (right) the primary outcome (mean ITBS score) is now placed at the bottom.
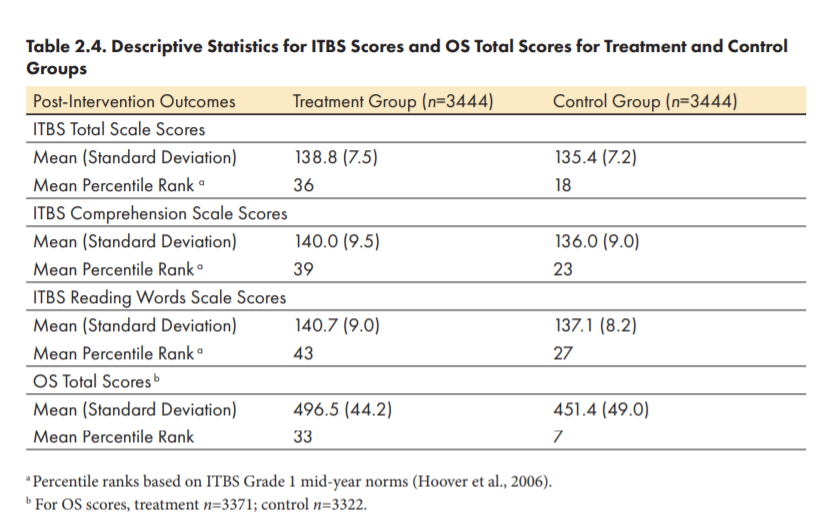


The RR pupils had a mean ITBS score of 138.8 (high is good) and controls 135.4. The mean difference of 3.4 is about half a standard deviation better (favouring RR). In the first year, with a quarter of the sample size, the scores were 139.2 and 135 respectively, also favouring RR by half a standard deviation, and very unlikely to have occurred by chance (P<0.001) (table 2).
But I’m afraid these results are biased. The only difference between the groups should have been the RR programme. But, as we have seen, there was another difference. The RR students were measured on a systematically “good day” but the controls on the same calendar day, which may, or may not have been a “good day” for them. We need not concern ourselves over the possibility of data dredging, P-hacking, repeated looks at the data, or any of the other biases that can creep in to unregistered trials, because the raw data are already clearly biased.
It is extraordinary that the researchers, the What Works Clearing House, and all the trial’s critics, not only missed the lack of registration or a published protocol, but this obvious bias in the timing of the primary and secondary trial outcome measures.
It’s great that educationalists are doing randomised trials, but they need to be done properly. Critics should study the methods carefully.
Jim Thornton
*FOOTNOTES – If you’re not convinced, consider a hypothetical pair of pupils, and that RR had no effect. Imagine that both pupils were bumping along with OS scores between say 12 and 15. Let’s further imagine that on week 15 the control pupil by chance had a good day and hit an OS score of 16, but the RR pupil, also by chance had a bad day and dropped to 11. These two scores would not be noticed; the trial goes on. Now imagine that the following week the RR pupil got things sorted out at home, did well and scored 16, while in his turn the control pupil had his share of home troubles and dropped to 11. Because the RR pupil had hit the magic score of 16 the RR stopped and the triallists measured both pupils. They are identical, each having had by chance one good day and one bad day, but if we measure them both on the RR pupil’s good day we get an RR data point of 16 and a control data point of 11.
The OS score is not the trial’s primary outcome, but it and the IELTS are both surely correlated with chance “good days”.
For the avoidance of doubt the subset of pupil pairs whose RR member battled on through the full 20 weeks are not biased, because they were each sampled at a point unrelated to either member’s achievement. But only about half of pupil pairs went on for this long.
I guess that, given the trial dataset, a more expert statistician than I could measure the variation in OS scores, the proportion of pupil pairs who stopped RR for success before 20 weeks, and the correlation between OS and IELTS scores, and use these data to model the bias that was likely to have been introduced by this test-timing method. It would be an interesting project.

When I see this:
“…37 percent participated in some individual or small-group intervention (other than Reading Recovery) provided by a Reading Recovery-trained teacher”
it’s hard not to suspect that the fix is in. I’m not saying deliberately, but this is an clear channel for the effects of unconscious bias (or worse).
Whenever strong proponents of a model being tested is responsible for the delivery of the control treatment, or for the training, instructing or equipping of those who are, or who are given sole charge of collecting potentially subjective differential data one must cast a wary eye on a study.
Better design for laissez-fair control must isolate experimenters with potential bias or model proponents from the control group and treatements applied to them.
I see this all the time in small-trial “controlled” experiments of this or that “discovery” or “inquiry” method of mathematical instruction. Those conducting the study are generally strong proponents of the method being examined, and either deliver both the objective treatment and the control or instruct those who do. Control is generally described as “direct instruction” or “taught algorithms”.
When a fuller description of the control is described in the writeup it is generally a sort of straw-man version of what one might expect in a “traditional” classroom, as seen through the eyes of those who denigrate such. You want to cry out “your bias is showing”. If it shows in the writeup about how the control was delivered you can be it shows in the delivery of that control as well.
Reblogged this on The Echo Chamber.
What ?