Standard, Population & Customised fetal size charts 12 – WHO
World Health Organisation (WHO) fetal growth charts
Like Intergrowth-21 these are standard charts. They were published in 2017 (click here).
Participants came from ten urban centres, Rosario Argentina, Campinas Brazil, Kinshasa Congo, Copenhagen Denmark, Assiut Egypt, Paris France, Hamburg-Eppendorf Germany, New Delhi India, Bergen Norway and Khon Kaen Thailand. They were all living below 1,500m, aged 18-40, with BMI 18–30kg/m2, a singleton pregnancy, gestational age at entry between 8-13 weeks, no chronic health problems or long-term medication, no environmental or economic constraints likely to impede fetal growth, non-smokers, with no history of recurrent miscarriages, preterm delivery or birth of a baby <2,500g. The ultrasonographer training and scan techniques were carefully standardised and quality controlled.
There were three major differences with Intergrowth-21. The WHO sample was smaller, only 1,387, compared with Intergrowth’s 4,321, which will have reduced the precision, especially of the outer centiles. WHO revealed the scan measures on the screen as the ultrasonographer placed the calipers, which could have biased the results (click here). Finally WHO used Hadlock’s formulae to estimate fetal weight, which may have affected those results, albeit in uncertain ways (click here).
The authors noted fetal sex differences in size, which others have also observed (click here). Otherwise, with the exception of estimated fetal weight, see below, the final charts were close to those of Intergrowth-21. Here are the two charts for head circumference. Note they are not exactly comparable since Intergrowth-21 left, gives 3rd, 10th, 50th, 90th and 97th centiles. WHO right, gives the 1st, 5th, 10th, 50th, 90th, 95th, and 99th.


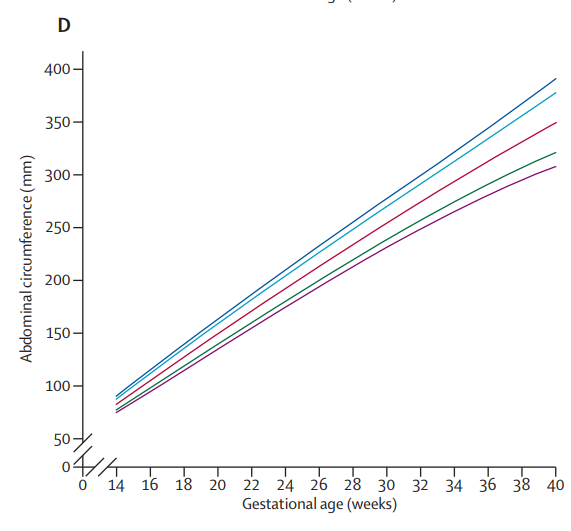
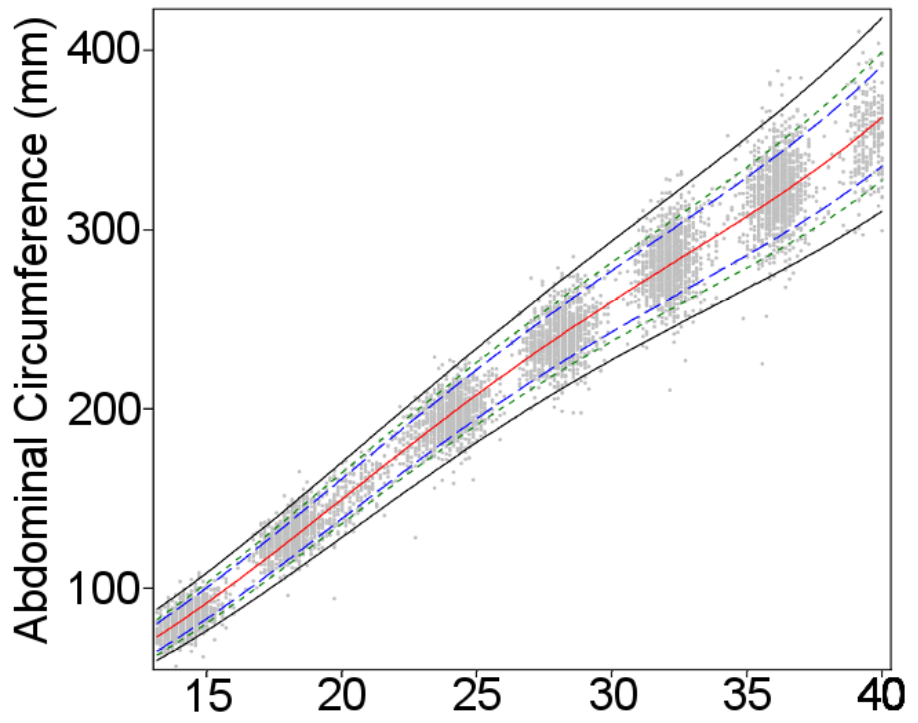
And here they are for abdominal circumference
The WHO researchers also published separate estimated fetal weight charts by country, and noted, in alleged contrast to Intergrowth-21, that some country charts differed significantly from the pooled chart. The explanation may partly be that the two groups of researchers used different statistical techniques to calculate the smoothed centile curves*. But there is no dispute that some geographical size differences remain.
The most likely explanation is that neither group managed to completely exclude malnourished women, or those with other environmental constraints on growth, from the populations they studied. Both made a valiant attempt to produce healthy standard charts, but are unlikely to be the last word on the topic (click here). Observing small differences, even in apparently healthy pregnancies, between some rich and poor countries does not prove the existence of an innate racial, ethnic or national difference on which we should customise.
Nevertheless seven of the WHO study’s twenty two authors see things differently and have gone on to strenuously argue (click here) that their data support the use of different charts for different populations. They provide no detailed prescription for how this should be done.
They wisely don’t support customisation by ethnicity since “Ethnicity, and particularly self-reported ethnicity, is not a straight-forward characteristic of a person or population”. Nor customisation by country since this is both impossible for the 185 countries for which WHO produced no chart, and makes even less sense than customisation by ethnicity!
The WHO data showed that older women had bigger babies (2–3% per 10 years), that multiparity increased fetal weight by 1–3%, and that maternal height increased it by 1–2% per 10 cm. All three effects more marked on smaller fetuses. Maternal weight also increased fetal weight by 1–1.5% per 10 kg, but that effect was greatest among larger fetuses. Recognising that none of these effects were large and exerted unequally among different weight centiles, the WHO authors accepted that any customization for individual use would be complicated, although “statistical development, growing computer power, and more data accrual should handle it”.
Perhaps so. But customisation requires more than just showing that size differs according to a particular feature. To make customisation useful we need to also show that the strength of the relationship between size and pathology is stronger than that between the feature and pathology. There is a strong relation between smoking and stillbirth (click here) but no-one wants to customise on that! The WHO authors did not even attempt to measure the strength of the relation between age, parity, height or weight to pathology, and compare each with that of size to pathology.
It is difficult to know exactly what in practice the seven WHO authors recommend, and tempting to conclude that they had some other dispute with Intergrowth-21 (see next post).
WHO and Intergrowth-21 are the best two fetal growth standard charts. Since Intergrowth-21 is based on a larger sample, and used better methods for avoiding bias, their charts are marginally to be preferred. It’s a bonus that they are also user-friendly and have been integrated into most of the leading scan software packages.
Next the WHO-Intergrowth plagiarism dispute (click here).
Jim Thornton
* For those who are interested, the Intergrowth-21 authors tested whether the distribution of values for each gestational age was normally distributed. It was, so they created their standards using a statistical technique, fractional polynomials, that required such a distribution. The WHO researchers in contrast used a technique, quantile regression, which required no assumptions about the data distribution.

Trackbacks