Standard, Population & Customised fetal size charts 10 – estimated fetal weight
Another technical digression
There are no customised charts for direct fetal scan measures. They only exist for fetal weight and fundal height. This suits parents and non-experts who, unfamiliar with fetal biometry, may prefer weight to say, the abdominal circumference centile. But it’s not straightforward for the obstetrician. Fetal weight is tricky to estimate, tricky to chart and tricky to interpret.
Once the baby is born we can weigh it. But until then we have to use formulae based on a combination of head, abdomen and femur measurements. The most popular were developed by Frank Hadlock in the 1980s, in Texas. He studied 276 fetuses each scanned within a week of birth (click here), which is rather few, especially as nearly half were less than 24 weeks. Nor would the details of his scan methods pass muster today (click here), although that is hardly his fault. Scan technology, and ways to reduce bias, have developed considerably since.
Turning weights, whether real or estimated, into a chart is also more complicated than just the choice of “population” or “standard” we discussed a few posts ago (click here). Charts based on babies actually born preterm, systematically underestimate centiles because babies born pre-term tend to be growth restricted. Normal weight babies at say 30 weeks, mostly don’t deliver at 30 weeks, so they can only be measured not weighed.
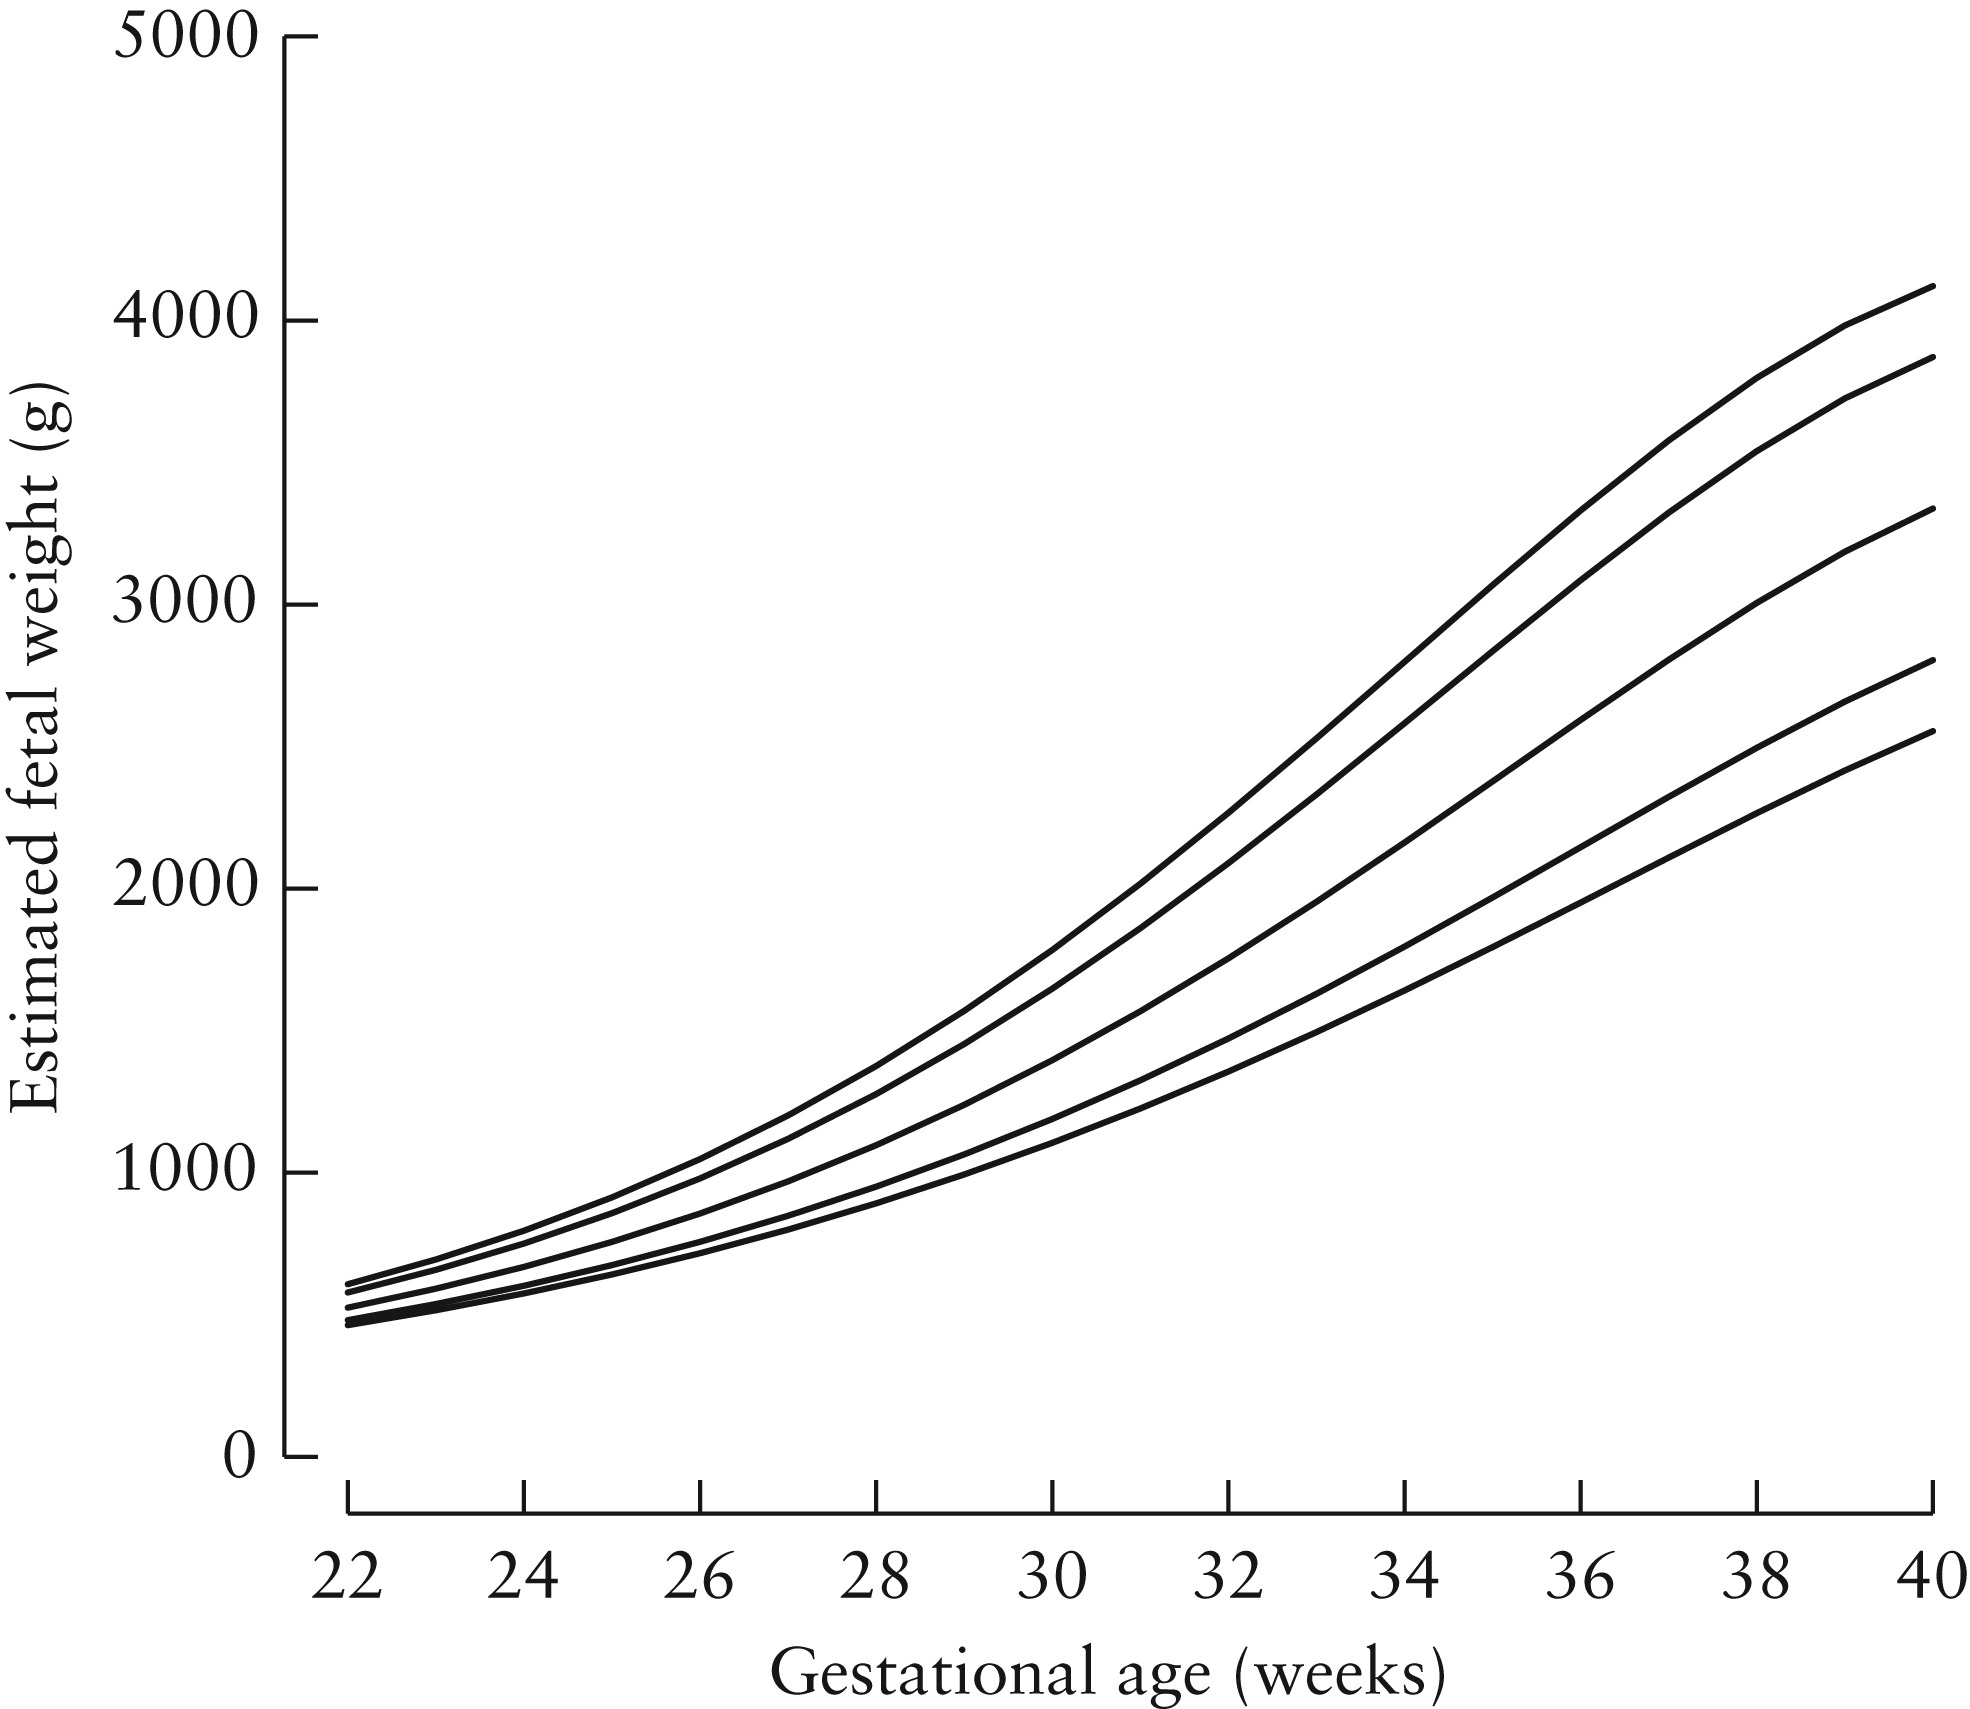
The figure below (taken from Stirnemann click here) shows the problem. The dotted lines are 3rd, 50th and 97th weight centiles based on babies actually born. The solid lines the same for all babies, including those who don’t deliver preterm. Not much difference at term (black square), but at 28 weeks a baby on the 50th centile of babies born at that gestation (black circle), lies below the 3rd for the whole population.

So how did Stirnemann and his Intergrowth-21 colleagues develop their chart? Their trick was this.
First they scanned a lot of fetuses, including those from unhealthy pregnancies, but using the up-to-date methods for avoiding bias. Some came from the Fetal Growth Longitudinal Study (FGLS) which we will describe later. The rest from an unselected cohort of women including smokers, and those with problem pregnancies, the INTERBIO‐21st Fetal Study. They then measured the birth weights of those babies who happened to be born within a short interval of the scan. There were 2,404 of these. Again they took special care with the birth weight measurements, drying the baby carefully, cutting the cord to a standard length, using a standard cord clamp and a trained person to work specially calibrated random-zero electronic scales to avoid digit preference. The babies born preterm included many that were not healthy, but that didn’t matter at this stage. They simply used the measurements, with a small correction for the interval between the measurement and the actual birth, to create new formulae for estimating weight from head, abdomen and femur measures. i.e. the same as Hadlock, but with a larger sample, and modern scanning, weighing and bias reducing techniques.
The second stage of the procedure was to apply those formulae to the scan measures from healthy babies in the Fetal Growth Longitudinal Study, i.e. the main Intergrowth-21 population. Those are the weights and centiles that comprise the Intergrowth-21 fetal weight standard charts. Here’s the final result. Left the chart in Stirnemann’s paper and right the nicely printed version for regular use.

Frank Hadlock knew, and the creators of customised charts like GROW also know, that fetuses born preterm are systematically lighter than those destined to be born at term. Both made similar adjustments (click here for Hadlock’s, and here for GROW’s methods). I’m not suggesting that either confuse the weights of babies actually born preterm with those that go on the deliver at term. However the GROW customised charts from the Perinatal Institute are based on weights estimated using Hadlock’s formulae, which themselves were created from a relatively small number of women in Texas in the 1980s, using the methods and scan machines available then.
Another issue with using ultrasound-based weight estimates to manage pregnancy is that they may not be the best predictors of babies who are likely to die, be brain damaged or unable to withstand the stress of labour. Expert interpretation of the individual measures from which the weight was estimated is often better. For example, if a fetus with a small abdominal circumference has relatively long legs or a big head, it will be heavier, but more malnourished.
Finally, since customised direct fetal measure charts don’t exist, obstetricians who use customised weight charts have to either ignore the individual components on which the weight was estimated, or use a non-customised chart to interpret those. At the very least a source of avoidable confusion.
Antenatal assessment of fetal compromise is complicated. That’s why we have fetal medicine specialists. Combining multiple size measures into a single estimate of weight may please parents, but is a potentially misleading simplification.
This is the last technical digression. Now we are ready to look in detail at the main modern charts, Intergrowth-21, WHO and the main customised chart, GROW. Tomorrow Intergrowth-21 (click here)
Jim Thornton

Trackbacks